Voice of Customer Analytics and Critical Quality Crisis Management in Mobile Ecosystem

In the Turkey operations of a global mobile technology manufacturer, unstructured technical data from large-scale end-user requests was fundamentally transformed into actionable strategic insights through a newly established quality intelligence system. Through this holistic system, chronic hardware crises developing silently in specific series (screen separation, motherboard failures) were diagnosed proactively. When after-sales operational costs drastically exceeded the industrial sustainability threshold of 2%, a sophisticated data-driven escalation protocol was immediately activated, enforcing formal risk management with the global manufacturer (HQ).
Project Portfolio
|
Parameter |
Value |
|---|---|
|
Category |
Quality Assurance & Crisis Management |
|
Delivery Type |
Data Mining, Risk Analysis & Strategic Vendor Management |
|
Role |
Operations Architect |
|
Scale |
~60,000 Mobile Devices, 8 Different Models |
Current Situation and Crisis
Context: Tens of thousands of active mobile devices dispersed across the Turkish market, and a relentless daily influx of thousands of complex end-user requests congesting the Technical Operations Center.
Problem: Far beyond ordinary physical damage cases, a systemic crisis severely threatening brand reputation and the distributor’s financial stability was silently escalating:
|
Problem |
Detail |
|---|---|
|
Data Noise |
Critical manufacturing defects were systematically buried amidst thousands of simple user-generated requests. |
|
Structural Integrity Loss |
Screens spontaneously separating from internal frames and aggressive ghost touch anomalies multiplying within specific batches. |
|
Blind Spot |
The Global R&D team aggressively interpreting tangible field increments in Turkey merely as “isolated incidents” rather than structural flaws. |
|
2% Threshold |
The warranty expenditure budget continuously exceeding the final sustainable risk threshold limits. |
Action and Solution Architecture
Architectural Approach: Instead of combating the crisis reactively model by model, a 3-layered data and negotiation architecture was formulated that mathematically and irrefutably proves the root cause of the syndrome at a macro scale.
Data Classification and Triage
The immense operational data was categorically purified from surrounding noise. All end-user requests were segmented by SKU and cleanly divided into two predominant tracking datasets:
Dataset A (Critical):
- Motherboard failures decisively sourced from manufacturing defects
- Assembly-based screen disassociations and core sensor losses
- Sudden death syndrome chain reactions
Dataset B (Noise):
- User-sourced functional and cosmetic errors
- Logistics and conventional infrastructure inquiries
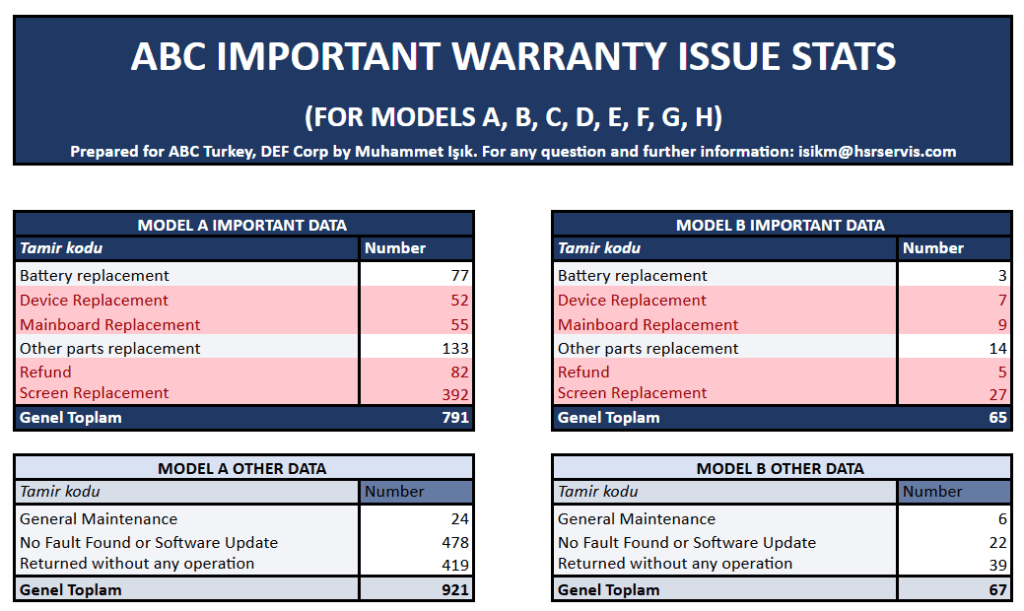
📸 Visual 1: Data Classification Table Example (Representative.)
Pattern Recognition and Root Cause Analysis
Execution analysis on the isolated Critical Dataset decisively revealed:
- Screen separations in strictly targeted models were structurally identified as fabrication adhesive insufficiency, irrefutably ruling out user error.
- An absolute tight correlation of software freezing issues in one unique series synchronously linked with a specific Over-The-Air (OTA) update deployment.
- Defective device serial numbers were programmatically matched with factory production dates, flawlessly enabling a comprehensive “bad batch” supply isolation.
Critical Findings by Model:
|
Model Group |
Failure Rate |
Critical Problem |
|---|---|---|
|
Series A |
21%+ |
Screen separation, motherboard |
|
Series B |
14% |
Screen + Security Lock |
|
Series C |
9% |
Sudden Death Syndrome |
|
Series D |
5% |
General screen problem |
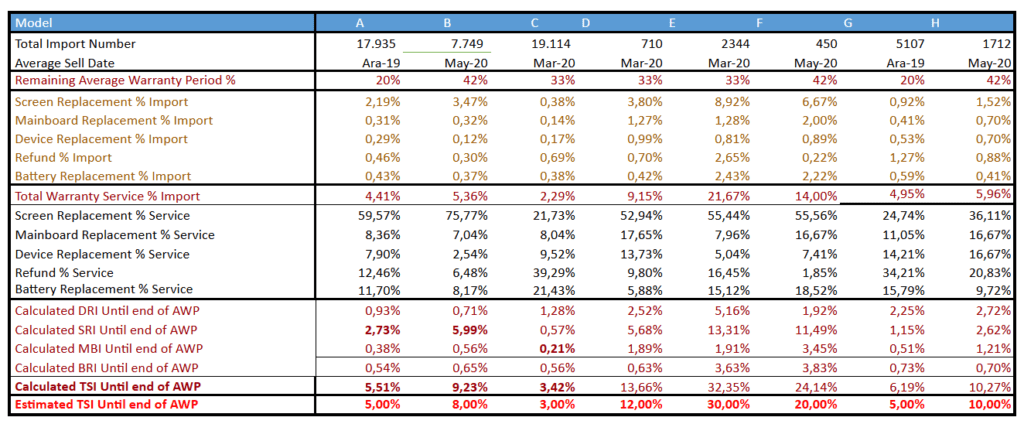
📸 Visual 2: Model-Based Failure Density – Service report table (Representative.)
Strategic Escalation and Financial Evidence
The prepared technical hardware analysis was strategically converted into the universal language of C-level management and the manufacturer (Vendor): financial metrics. Instead of a standard reactive technical support mechanism, a formal “Commercial Risk Notification” framework was conceptualized.
Analysis:
- Total “Unit Import Cost” versus “Operational Cost Center” profitability explicitly compared parallelly for each production series.
- It was numerically proven that warranty costs massively exceeded the 2% global norm, shifting unit profitability negatively and rendering the model financially unsustainable.
- Comprehensive series-based operational loss projection architecture built and finalized.
Action: Official defect notification declaration and high-priority status reporting dispatched directly to global headquarters.
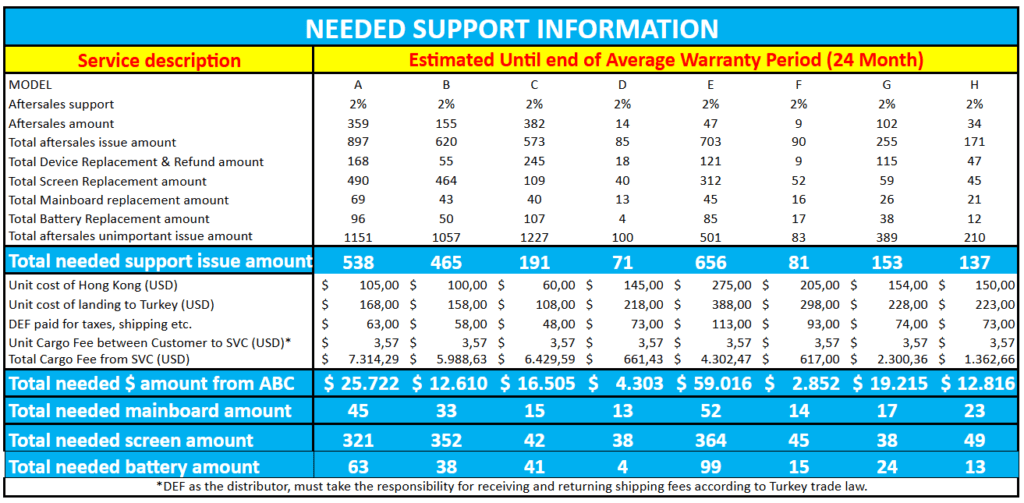
📸 Visual 3: Official crisis notification content sent to HQ (Representative.)
Operational Gains
Operational Transformation:
|
Gain |
Impact |
|---|---|
|
Risk Visibility |
The operational risk was seamlessly transformed from an abstract engineering estimation into a transparent, quantifiable loss projection matrix for the executive board. |
|
Strategic Result |
Confronted with irrefutable, cross-verified data reports, the global manufacturer was strategically cornered into confirming the architectural failure was manufacturing-sourced, triggering warranty liability compensation protocols. |
|
Early Warning System |
Critical defects emerging in subsequent production allocations became pre-emptively detectable on a “Zero-Day” level, shutting down anomalies before they spiraled into mass recall turbulence. |
|
Operational Transparency |
A permanent, flawless mathematical foundation was embedded within the workflow to justify abrupt stop-sale strategies. |
📋 Related Links
🔗 Project Card: L1/L2 Support Architecture and Knowledge Management
🔗 Project Card: IoT Operations Architecture