End-to-End Service and Diagnostic Operations Architecture for IoT and Wearable Device Ecosystem

A “Greenfield” service architecture was structurally designed for the Technical Operations Center managing the massive 140,000-unit Turkey ecosystem of global IoT accessory manufacturers (4 brands, 13 models). All disjointed processes from fault diagnosis (Diagnostics) to final reporting were systematically standardized through rigorously prepared Standard Operating Procedures (SOP), a 24-category error code taxonomy, and structured test instructions. A definitive transition was achieved from a person-dependent “Craft” tracking model directly to a highly scalable “Industrial” operation model.
Project Portfolio
|
Parameter |
Value |
|---|---|
|
Category |
Process Digitalization & Service Architecture |
|
Delivery Type |
Operational Process Design (SOP) |
|
Role |
Operations Architect |
|
Scale |
140,000+ IoT/Wearable Devices, 13+ Product Models, 4 Brands |
Current Situation and Challenge
Context: A highly saturated IoT/Wearable operational structure containing 4 major brands, 13 different models, and effectively reaching 140,000+ consumer endpoints.
Critical Problems:
|
Problem |
Impact |
|---|---|
|
Data Pollution |
The operations team blindly entering diverse arbitrary descriptions like “Won’t turn on”, “No power”, “Dead” for the identical technical fault rendered root cause analysis completely impossible. |
|
Lack of Test Standard |
Verification and validation (V&V) processes being irresponsibly left to individual artisan initiative radically increased the bounce rates of defective devices. |
|
Reporting Chaos |
The legacy database structure was functionally unsuitable for basic analytics, forcing 1,500+ lines of agonizing manual editing per cycle. |
|
Logistics Waste |
Completely unacceptable 5-7 day pipeline delays frequently resulting from raw product transportation between the technical center and main warehouse. |
Highlighted Risk Models:
|
Model Group |
Volume |
Service Rate |
Status |
|---|---|---|---|
|
Neckband Type TWS |
Low |
16% |
🔴 Critical |
|
Compact TWS (Model A) |
Low |
14% |
🔴 Critical |
|
High Volume TWS |
High |
3% |
⚠️ Volume margin risk |
Solution Architecture and Action Plan
Architectural Approach: The pre-existing operational chaos was rigorously disciplined and industrialized through the abrupt establishment of strict data and process governance rules.
Greenfield Operations Center Setup
A physical technical operations center infrastructure was meticulously established natively within the company’s own primary facility:
Procured Setup Equipment:
- Ampere-metered diagnostic charging units
- Calibrated multimeter measurement devices
- Acoustic decibel precision meters
- Antistatic workstation cloths, inspection cameras, tool bags, barcode scanners, and sustained consumables
Total Investment: ~$750 / Workstation Set
Error Code Taxonomy Implementation
Subjective free-text fault descriptions were strictly prohibited. Highly standardized hierarchical error codes were systematically architected containing 3 main vectors and 24 root categories:
Predefined Error Codes Structure Example:
By Fault Source (X)
0. No Issue Found
1. Under Warranty
2. Out of Warranty
By Fault Type (Y)
0.0. No Issue Found
1.1. Not Working / Totally Unresponsive
1.2. Bluetooth Connection Problem
1.3. Battery / Charging Problem
1.4. Acoustic Sound Problem
1.5. Mechanical and Core Material Problems
1.6. Special Customer Satisfaction Actions
2.6. Out of Warranty Exclusion
Specific Fault Detail (Z)
E01 - Battery Cell Failure
C03 - Bluetooth Connectivity Flaw
H12 - Severe Physical Damage (Void Warranty)
N00 - No Issue Verified
Execution Strategy:
- Each physical device was hard-labeled with a distinct 3-letter barcode tag.
- The fundamental evaluation and triaging process was dramatically accelerated.
- Highly specific customer report output texts were auto-generated matching each unique fault code.
Formulation of Standard Routine Test Procedures
A comprehensive diagnostic test algorithm containing strictly ordered 45+ steps was formally instituted for each product group:
Test Protocol Flow Architecture Example:
1. Sequential removal of protective packaging tapes
2. Mandatory pre-test directly correlating to the customer complaint
3. Severe abuse inspection (chemical cleanliness check)
4. Macro physical damage inspection (deep scratches, dents, structural cracks)
5. Manufacturing-sourced microscopic physical defect evaluation
6. Circuit board burn/melt/overheating smell inspection
7. Primary charging process (30min lock) and continuous current stability check
8. Case-to-earphone pin charge contact validation test
9. Handshake & Bluetooth pairing test
10. Sustained sound playback test (calibrated decibel measurement)
11. Microphone input/active call loop test
12. Load battery life depletion test (15min playback maxing a rigid 10% decrease expectation)
13. Automatic shutdown / smart case hibernation test
Error Code Logic (X.Y.Z System):
|
Code |
Meaning |
Translation Example |
|---|---|---|
|
0.0.1 |
No Issue Found |
Fully normal operation verified |
|
1.1.1 |
Electronic Failure |
Zero response registered in left earphone |
|
1.2.1 |
Pairing Problem |
Disconnected sync between TWS earphones |
|
1.3.1 |
Charging Issue |
Earphone module flatlining, not charging |
|
1.4.1 |
Sound Problem |
Absolutely no acoustic playback sound |
|
1.5.1 |
Physical Component |
Metal pin contact problem |
|
2.0.1 |
Out of Warranty |
Verified user neglect / Abuse |
|
2.0.2 |
Out of Warranty |
Critical physical hardware damage |
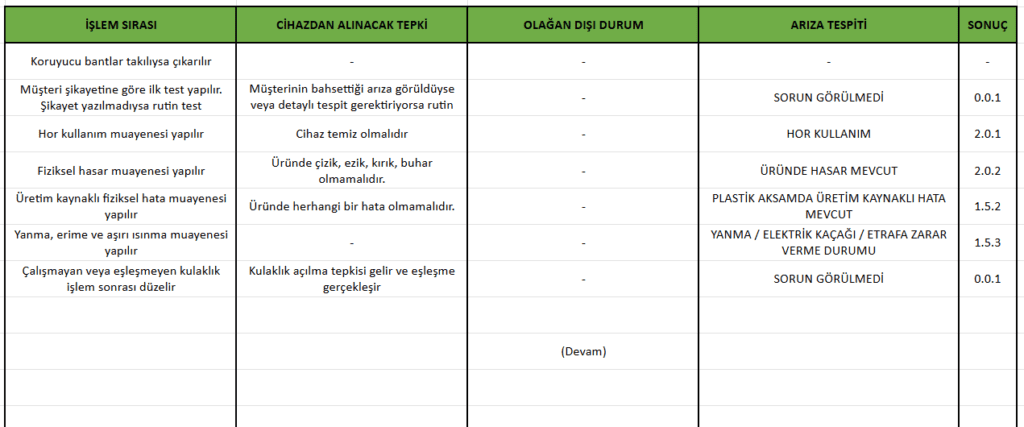
📸 Visual 1: Routine Standard Test Procedure Document Extract – 45+ Step Algorithm and Binary Decision Tree (Representative.)
New Reporting Architecture
The chaotic legacy database was entirely vaporized and systematically redesigned to match the new process architecture:
Accessible Primary Data in the New Table Structure:
- Exact failure rates (indexed model-based)
- Hardware failure sources (indexed error code-based)
- Precisely tracked service Entry/Exit timestamps
- Granular customer identity information
- Final device disposition state resolution
Weekly Governance System: Identified entry errors and minor deficiencies were promptly audited and corrected to maintain an uncompromised blanket of data integrity.
Results and Operational Gains
Process Numerical Results
|
Target Metric |
Verified Value |
|---|---|
|
Total Hardware Processed |
High Tier Volume |
|
Under Warranty Validated |
Vast Majority |
|
No Fault Found Ratio (NFF) |
Regulated to ~37% |
|
Monthly Diagnostic Output |
Maximum Engineered Efficiency |
Core Operational Gains
|
Gain Vector |
Impact Detail |
|---|---|
|
Scalable Architecture |
An extreme 140,000 hardware device volume immediately became manageable without triggering paralyzing additional labor costs via pure standardized logic. |
|
Executive Analytical Competence |
The haunting question of “Which fault type is actively chronic in which model?” became permanently answerable for the C-level board with a single interface click. |
|
Chronic Anomaly Identification |
Anomalous “temporary fault” patterns falsely reported in TWS models were structurally identified as deeply chronic manufacturing flaws. |
|
L1 Boundary Filtering |
Supported by extensive customer service technical training, “no fault found” (NFF) returns previously polluting the service center were blocked and minimized at the source stage. |
Major Problem Pattern Discovery
Critical operational anomalies were pre-emptively detected leveraging the governed data:
Core Finding: Discovering a massive, unsustainable number of “No Fault Found” ticket cases billed in a specific high-volume TWS model → Deep anomaly statistics proved the incoming reports were insufficient and the temporary fault pattern had actually become chronic hardware failure → The global operational policy was urgently forcibly revised mitigating millions in loss.
📋 Related Links
🔗 Project Card: VoC Analytics and Critical Quality Crisis Management
🔗 Project Card: L1/L2 Support Architecture and Knowledge Management