VoC Analytics and Critical Quality Crisis Management in Mobile Ecosystem

|
Parameter |
Value |
|---|---|
|
Category |
Industrial Automation & IIoT (Quality Assurance & Crisis Management) |
|
Delivery Type |
Data Mining, Risk Analysis & Strategic Vendor Management |
|
Role |
Operations Architect |
|
Scale |
~60,000 Mobile Devices, 8 Different Models |
In the Turkey operations of a global mobile technology manufacturer, unstructured technical data from large-scale end-user requests was transformed into meaningful strategic insights through an established quality intelligence system. Through this system, chronic hardware crises developing in specific series (screen separation, motherboard failure) were diagnosed early. When after-sales costs exceeded the industrial sustainability threshold of 2%, a data-driven escalation protocol was activated and risk management was conducted with the global manufacturer (HQ).
The Challenge (Situation)
Context: Tens of thousands of active mobile devices in the Turkish market and thousands of complex end-user requests reaching the Technical Operations Center daily.
Problem: Beyond ordinary “broken/cracked” cases, a silent crisis threatening brand reputation and distributor financial structure was growing:
|
Problem |
Detail |
|---|---|
|
Data Noise |
Critical manufacturing defects were lost among thousands of simple “forgot password” requests. |
|
Structural Integrity Loss |
Screens spontaneously separating from frames and ghost touch incidents in specific batches |
|
Blind Spot |
Global R&D team interpreting increases in Turkey field as “isolated cases” |
|
2% Threshold |
Warranty budget (OPEX) exceeding critical risk threshold |
The Solution (Action)
Architectural Approach: Instead of fighting the crisis reactively (replacing one by one), a 3-layered data and negotiation approach was established that mathematically proves the root cause of the problem.
Data Classification and Triage
Operational data was purified from noise. All end-user requests were separated by SKU and divided into two main datasets:
Dataset A (Important – Critical):
- Manufacturing defect-sourced motherboard failures
- Screen separation and sensor losses
- Sudden death cases
Dataset B (Other – Noise):
- User error
- Cosmetic issues
- Logistics requests
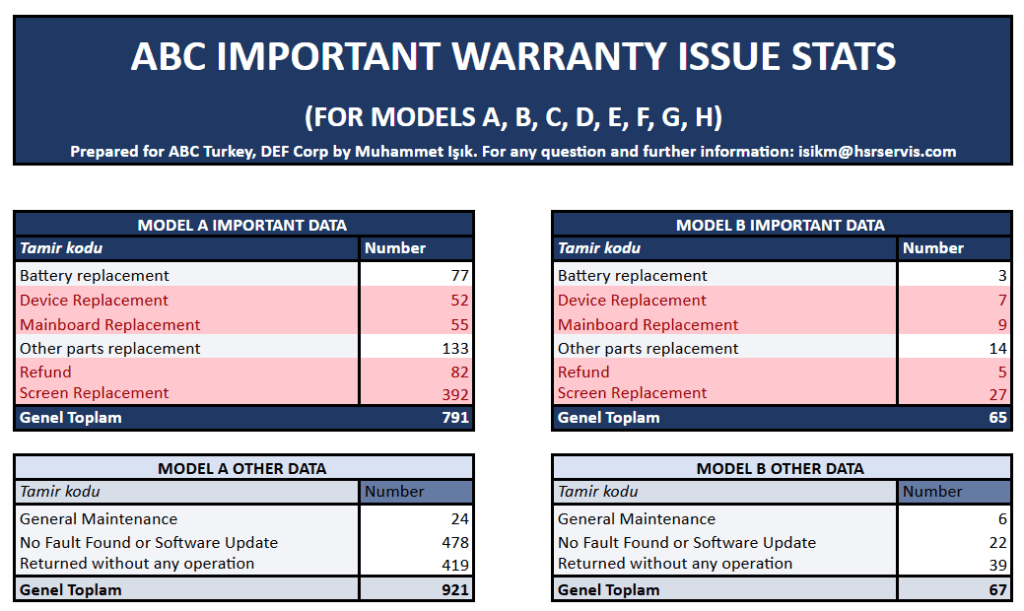
📸 Visual 1: Data Classification Table Example (Representative.)
Pattern Recognition and Root Cause Analysis
Analysis on the separated “Important” datasets revealed:
- Screen separations in specific models were identified as adhesive insufficiency, not user error
- Correlation of freezing issues in one series with a specific software update (OTA) was determined
- Defective device serial numbers were matched with production dates for “bad batch” isolation
Critical Findings by Model:
|
Model Group |
Failure Rate |
Critical Problem |
|---|---|---|
|
Series A |
21%+ |
Screen separation, motherboard |
|
Series B |
14% |
Screen + Security Lock |
|
Series C |
9% |
Sudden Death |
|
Series D |
5% |
Screen problem |
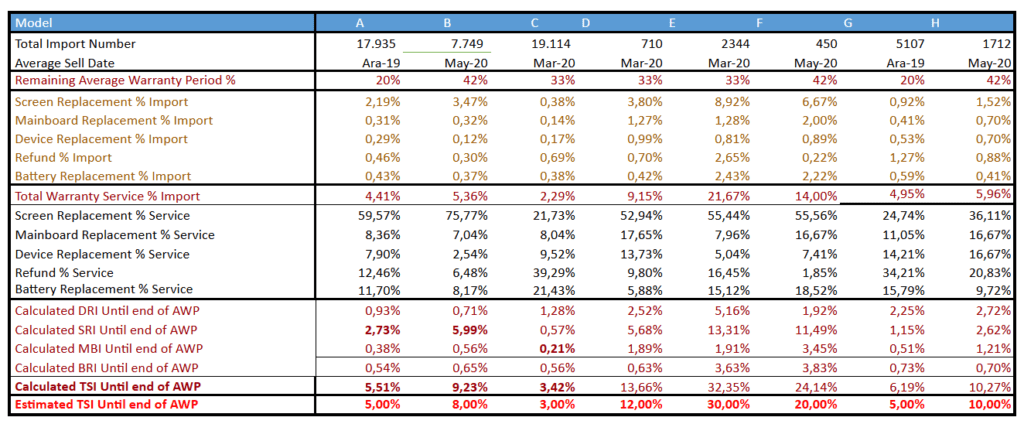
📸 Visual 2: Model-Based Failure Density – Service report table (Representative.)
Strategic Escalation and Financial Evidence
The prepared technical analysis was converted into financial language that management understands. Instead of “Technical Support Request,” a “Commercial Risk Notification” was made.
Analysis:
- “Unit Import Cost” vs “Operational Cost” compared for each series
- Warranty costs significantly exceeding 2% and unsustainability reported
- Series-based loss projection prepared
Action: Official status notification email sent to global headquarters (HQ).
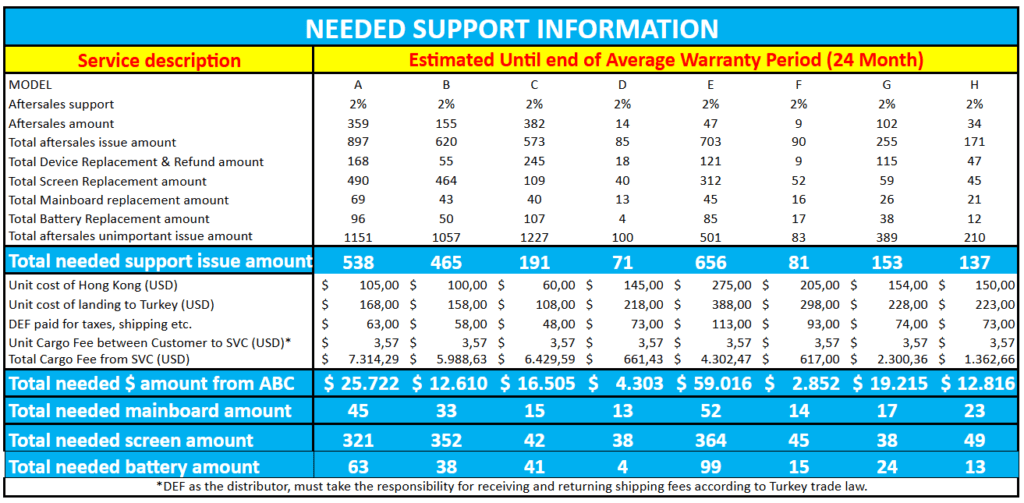
📸 Visual 3: Support request content sent to HQ (Representative.)
The Result (Outcome)
Operational Gains:
|
Gain |
Impact |
|---|---|
|
Risk Visibility |
Operational risk transformed from “estimation” to a clear “loss projection” for the board |
|
Strategic Result |
Global manufacturer was compelled to acknowledge the problem as manufacturing-sourced based on data-proven reports |
|
Early Warning System |
Defects in subsequent production batches became detectable before turning into mass returns |
|
Operational Transparency |
Numerical basis established for stop-sale decisions |
📎 Related References
- Project Card: L1/L2 Support Architecture and Knowledge Management
- Project Card: IoT Operations Architecture
Last Updated: January 2026